The 30-Indicator Problem
Every second, global markets generate millions of data points. Every trader processes dozens of signals. Every decision carries risk.
In our conversations with quantitative traders and hedge funds, one challenge emerges repeatedly: even sophisticated trading operations struggle to synthesize multi-dimensional technical indicators in real-time. As Point72's Mark Herr recently told Bloomberg: "The amount of publicly accessible data can now be compared to a fire hose of information. People who can read the signals most accurately and analyze them are the ones who will generate returns." Institutional Investor
This crystallizes the core challenge: how do you transform 30+ technical indicators into systematic, algorithmic decisions that execute in under 500 milliseconds?
Building the Synthesis Engine
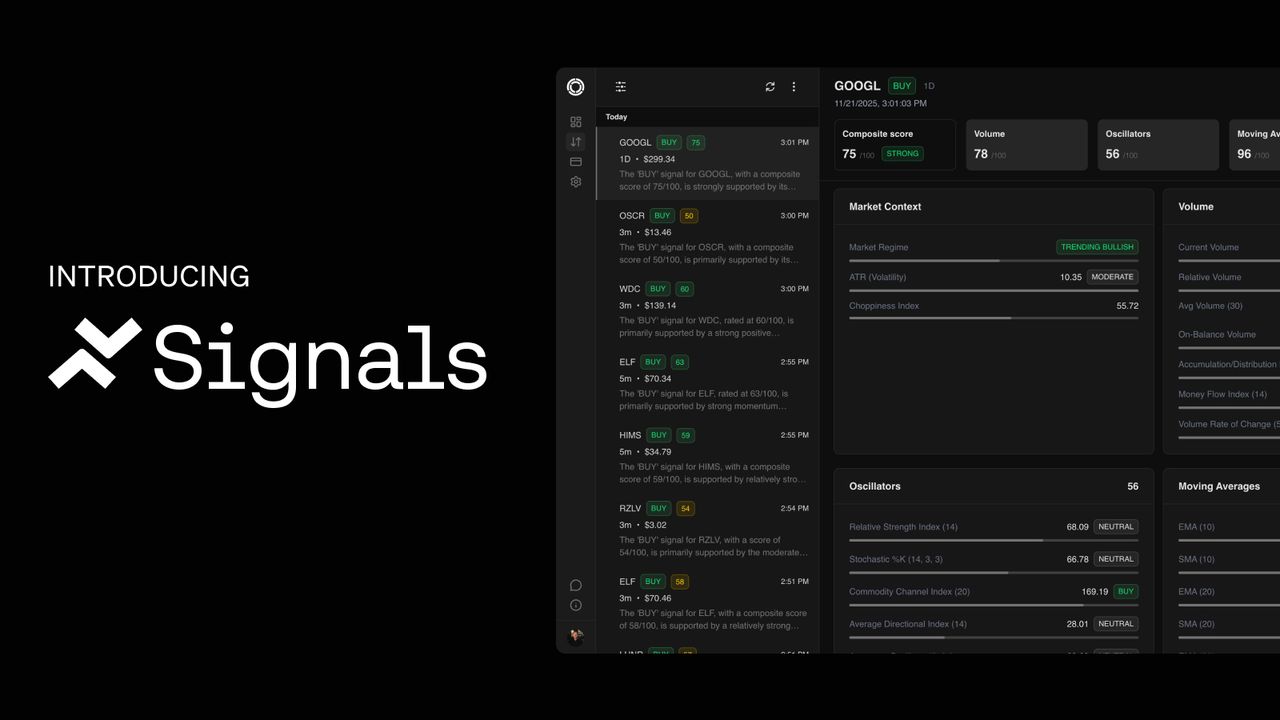
At Orbital AI, we approached this challenge from first principles. Rather than adding another indicator to the noise, we built Orbital Signals—a composite intelligence layer that transforms raw technical signals into normalized, actionable scores.
The engineering challenge was substantial. Consider what happens in a single scoring operation:
T+0ms: Webhook received from TradingView strategy
T+50ms: Market data fetched, validated, and cached
T+200ms: 30+ technical indicators computed in parallel
T+350ms: Statistical normalization applied across three mathematical frameworks
T+400ms: Market regime detected and weights adjusted
T+450ms: Composite score calculated and delivered
Each step represents months of optimization. The parallel computation engine alone required custom implementations of technical indicators optimized for vector operations. The normalization system—which we call Hybrid Adaptive Normalization—combines percentile ranking, z-score analysis, and logistic smoothing in ways that adapt to market conditions in real-time.
The Architecture of Intelligence
Orbital Signals organizes market analysis into four computational pillars:
Oscillators (30% default weight)
Thirteen momentum indicators, from RSI to proprietary WaveTrend oscillators, each individually normalized and weighted based on backtested significance.
Moving Averages (30% default weight)
Seven trend systems including Zero Lag EMA and Kaufman Adaptive averages, providing multi-timeframe trend confirmation.
Volume (20% default weight)
Six participation metrics that validate price movements, with time-of-day adjustments for market microstructure patterns.
Sentiment (20% default weight)
AI-processed news and social signals, with expansion planned for options flow and alternative data sources.
But the innovation isn't in the indicators themselves—it's in how they interact. Through Dynamic Regime Detection, the system identifies whether markets are trending, ranging, or experiencing volatility regimes, then adjusts its normalization and weighting accordingly.
Normalization: The Hidden Challenge
Raw indicator values don't tell the whole story. An RSI reading of 70 might signal "overbought" in a quiet market, but in a strong uptrend, it could mean momentum is just getting started. Traditional systems miss this context, applying the same rules regardless of market conditions.
We built Orbital Signals to understand context. The system looks at each indicator through multiple lenses—how it compares to its recent history, how far it deviates from normal, and where it sits within its typical range. More importantly, it adjusts this analysis based on what the market is actually doing:
- In trending markets, the system balances historical context with statistical significance
- In ranging markets, it emphasizes mean reversion patterns
- In volatile conditions, it becomes more conservative to avoid false signals
This adaptive approach means the same RSI reading gets interpreted differently depending on market conditions—just as an experienced trader would do, but systematically and consistently.
The Customization Layer
Every trader has their own style. Some trust momentum indicators above all else. Others swear by moving averages. Many have specific indicators they've found work best for their markets.
Orbital Signals adapts to your approach in two ways:
Quick Start with Strategy Profiles
Choose from preset configurations optimized for different trading styles—Momentum, Trend Following, Mean Reversion, or Balanced. Each profile has been tested across various market conditions to provide reliable starting points.
Manual Configuration
Beyond presets, traders have complete control over the scoring system:
- Category Weights: Adjust the four main pillars (Oscillators, Moving Averages, Volume, Sentiment) from their default 30/30/20/20 distribution to match your trading philosophy
- Individual Indicator Weights: Fine-tune the weight of each specific indicator within its category—increase RSI's importance within oscillators, emphasize ZLEMA within moving averages, or prioritize relative volume metrics
This dual approach ensures that whether you prefer a quick start with proven configurations or want to craft a completely custom scoring system, Orbital Signals adapts to your specific trading methodology. The system maintains its sophisticated normalization and regime detection regardless of how you choose to weight the components.
Real-World Application
The true test of any scoring system lies in its practical application. Orbital Signals processes webhook signals from TradingView strategies and delivers composite scores in under 500 milliseconds—fast enough for high-frequency trading environments where timing is critical.
Consider how the system handles a typical scenario: A TradingView strategy signals a potential long position in a major tech stock. Individual indicators might show mixed signals—RSI reading neutral, MACD showing a bullish crossover, volume above average, moving averages converging, and mild positive sentiment from news sources.
Where a trader might struggle to weigh these conflicting signals manually, Orbital Signals processes all indicators through its normalization framework, applies market regime detection, and delivers a single composite score. A score of 75 would indicate strong alignment across the weighted pillars, suggesting a higher-probability setup.
Now multiply that analytical power. The system can simultaneously process hundreds of symbols across multiple timeframes—analyzing 5-minute setups for day trades while monitoring daily charts for swing positions. While you're evaluating one signal, Orbital Signals is already scoring dozens more, ensuring you catch high-probability setups wherever they emerge in your watchlist.
The system's value lies not in guaranteeing outcomes—no system can do that—but in providing consistent, probability-based analysis that removes emotional bias and processing delays from the decision-making process. Every score represents a statistical edge, helping you allocate capital to the highest-probability setups across your watchlist, whether you're tracking 5 stocks or 500.
The Transformation Imperative
Markets are evolving faster than human cognition can adapt. Average holding periods have decreased 90% over the past two decades. Information propagation that once took minutes now happens in microseconds. The investors who succeed in this environment won't be those with more indicators—they'll be those with better synthesis.
As research from AQR Capital Management notes: "Efficient market theory assumes that once new information is released, it is instantly available to all investors and that prices immediately adjust to reflect the news. In practice, however, different investors receive news from different sources, and react to news over different time horizons and in different ways." AQR Capital Management This gap between theory and practice creates the opportunity for systematic synthesis.
Orbital Signals represents our contribution to this evolution: a system that preserves human judgment while adding computational intelligence where it's needed most. It's not about replacing traders; it's about amplifying their capabilities.